Research Article - Modern Phytomorphology ( 2022) Volume 16, Issue 5
Annual NDVI dynamics observed in industrial tomato grown in the south of Ukraine
Pavlo Lykhovyd1*, Raisa Vozhehova2 and Sergiy Lavrenko32Institute of Irrigated Agriculture of NAAS, Director, Naddniprianske, 73483 Kherson, Ukraine
3Kherson State Agrarian and Economic University, Department of Agriculture, Stritenska Street 23, 73006 Kherson, Ukraine
Pavlo Lykhovyd, Institute of Irrigated Agriculture of NAAS, PostDoc Department, Naddniprianske, 73483 Kherson, Ukraine, Email: pavel.likhovid@gmail.com
Received: 29-Jul-2022, Manuscript No. mp-22-70692; Accepted: 28-Aug-2022, Pre QC No. mp-22-70692(PQ); Editor assigned: 02-Aug-2022, Pre QC No. mp-22-70692(PQ); Reviewed: 15-Aug-2022, QC No. mp-22-70692(Q); Revised: 25-Aug-2022, Manuscript No. mp-22-70692(R); Published: 30-Aug-2022, DOI: 10.5281/zenodo.10012129
Abstract
NDVI is widely used in crop production in the context of precision agriculture and geoinformation systems. The purpose of the study was to determine the seasonal variation pattern of the spatial vegetation index of industrial tomato crops grown in southern Ukraine. The data on the NDVI values of the crop during the study period 2016-2021 were collected on One Soil AI platform, combining Sentinel-1 and Sentinel-2 imagery the index determination. The tomato fields, which were analysed in the study, located in different regions of Kherson and Mykolaiv regions (Ukraine), and included regular spring and late summer tomato plantations. As a result, the genuine annual NDVI dynamics was established that is helpful for the identification of tomato crops by spatial monitoring. Connecting the values of the vegetation index to the crop phenology revealed that each phenological phase has its individual range of NDVI values. The highest NDVI values were recorded in the phase of fruit formation, while the lowest were recorded in the planting phase and at the period from fruit ripening to maturity. The results of the study provide novel insights on the annual pattern in NDVI dynamics on tomato and could be implemented in the crop mapping and crop differentiation systems
Keywords
Remote sensing, crop mapping, growing season, vegetation pattern, phenology
Introduction
The Normalized Difference Vegetation Index (NDVI) was first proposed by Rose et al. (1974), in recent decades it has become the standard for remote sensing of flora conditions. Today, it is one of the most practical and easy to access spatial vegetation indicators used by ecologists and agronomists to successfully use it in scientific and practical work. (Lykhovyd et al., 2020; Vozhehova et al.,2020; Shammi & Meng, 2021). Despite the flaws associated with distortions from the atmospheric and soil reflectance impacts, NDVI remains the most popular spatial vegetation index owing to its ability to represent the intensity of plant growth processes (Savin & Negre, 2003; Tian et al., 2016; li et al., 2019).
Attention is paid to the direction aimed at distinguishing the seasonal and annual patterns of NDVI dynamics in different plant forms, including cultivated crops. Such models are very important in the automatic control and recognition of vegetation cover between different types of vegetation. Furthermore, dynamic patterns are important for improving spatial crop monitoring and are used to support agricultural decision-making systems within the framework of accurate agriculture. Scientists succeeded in precisely monitoring of crops vegetation through the remotely sensed NDVI in wheat, soybeans, grain corn, etc. (Pan et al., 2015; Seo et al., 2019). A strong direct correlation between the spring wheat growth, productivity and seasonal NDVI dynamics led to the conclusion that crop growth could be accurately estimated using remote sensing data (Magney et al., 2016). The seasonal dynamics of the NDVI have been shown to be an effective tool for a detailed irrigation schedule (Trout & Johnson, 2007; O’Connell et al., 2010).
Ukrainian scientists in this regard are less productive than their foreign colleagues. The direction of the use of remote sensing data for crop monitoring has not yet been sufficiently studied and developed. However, several Ukrainian studies have been carried out to discover NDVI dynamics patterns in natural plants (Zhukov & Gofman, 2016), as well as it has been proved that remote sensing data are of a great use for remote detection of crops phenology (Dychenko & Laslo, 2020). The latter is one of the relevant tasks of modern agricultural science, which is to provide reliable and effective tools for monitoring the phenology of crops in large areas by remote sensing. Therefore, the purpose of this study was to determine the patterns of annual NDVI dynamics in tomato crops, cultivated in the South of Ukraine as a major vegetable, and connect NDVI values to the stages of the crop growth and development.
Materials and Methods
The study of annual NDVI dynamics in industrial tomato crops (including those planted in May and those planted in June) was performed using the remote sensing data from the OneSoil AI platform for the period 2016-2021 in the fields of agricultural holding 'Agrofusion'. All tomato crops were grown by California industrial agrotechnology under drip irrigation, all hybrid intensive crop hybrids. The OneSoil AI platform provides NDVI based on combined Copernicus Sentinel-1 and Sentinel-2 imagery with a spatial resolution of 250 m, each pixel corresponds to 5×5 m square. Sentinel-2 images are used to distinguish crops, and Sentinel-1 screens are used for further adjustment of NDVI computation and diminishment of possible distortions. NDVI data on the platform are provided for regular 8-day and 16-day periods. We calculate the means of the months (as the sum of the NDVI values of the months divided by the number of enrolled months values) by every month for tomato crops grown at the following locations in the Kherson and Mykolaiv regions of Ukraine: 46.258335N, 32.442788E; 46.288829N, 32.015351E; 46.144930N, 32.703799E; 46.571921N, 32.383808E; 46.736693N, 32.042830E; 46.751308N, 32.517860E (all coordinates are in decimals by Google Maps). A total of 122 records were made on fixed plots in research fields. The lower NDVI limit for fields representing crops was calculated in previous research, and averaged at 0.22 (Lykhovyd, 2021). The NDVI data were further related to the terms of the phenological phases of tomato cultivation, based on the results of field observations carried out during the study period. Phenological phases were determined using the domestically accepted methodology and included the periods of planting the seedlings, green biomass growth, budding, flowering, fruit formation, and fruit ripening to maturity (Ushkarenko et al., 2020). The phenological phase began when 75 per cent of the plant on the field had a typical appearance. The standard deviation (SD) of NDVI was calculated using common statistical methodology (Wan et al., 2014).
Results and Discussion
As a result of the research, it was found that tomato plants have their unique pattern of annual growth dynamics that is well described and explained by the NDVI values. It was established that the highest NDVI values in tomato crops were recorded in July for the May-planted crops, and in August – for the June-planted ones, respectively. Green biomass senescence begins in August in spring tomato plantations and in September in summer plantations. In addition, it was recorded that June plantations of tomato demonstrate more acute dynamics to vegetation cessation. Full senescence of the crop is recorded in late August-September for the May-planted tomato, and in mid-October-November for the June-planted crop (Fig. 1-6).
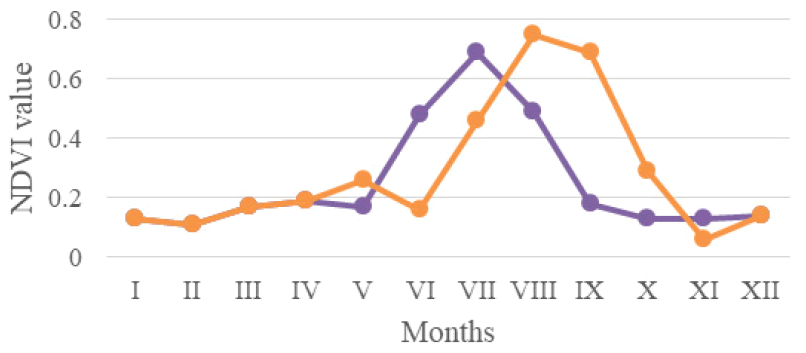
Figure 1: Annual NDVI dynamics in tomato crops (orange line â?? crops planted on May, green line â?? crops planted on June).
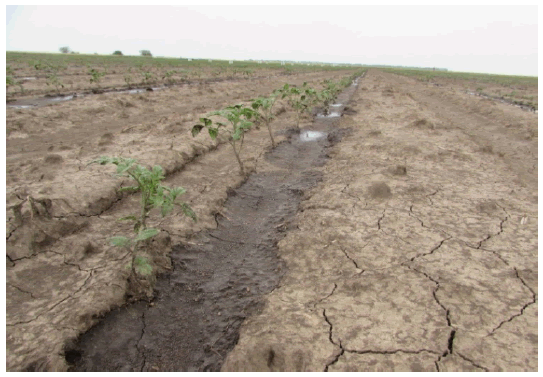
Figure 2: Tomato crops after planting the seedlings.
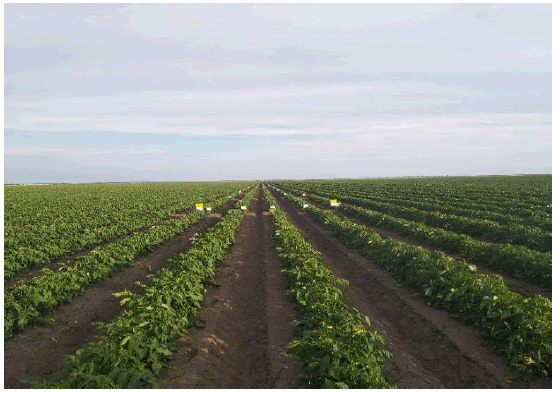
Figure 3: Tomato crops in the phase of green biomass growth.
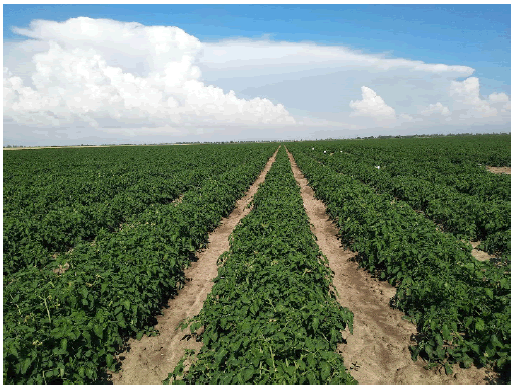
Figure 4: Tomato crops at the end of budding â?? beginning of flowering phase.
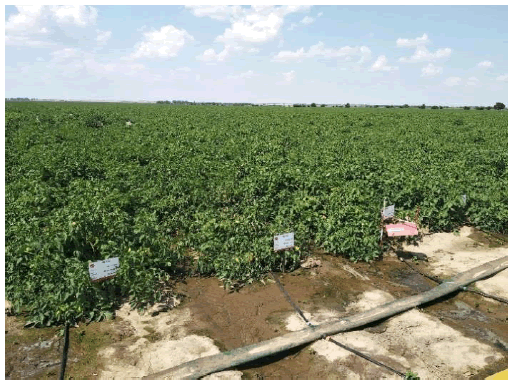
Figure 5: Tomato crops in the phase of fruit formation
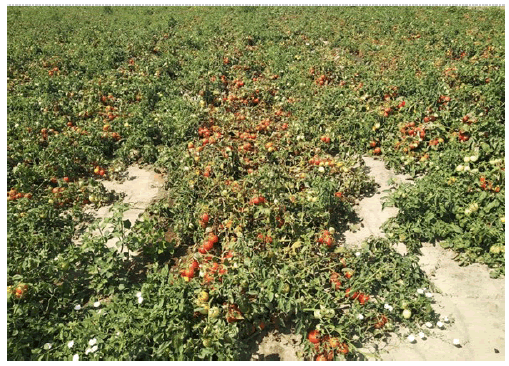
Figure 6: Tomato crops in the phase of fruit ripening to maturity
Connection of NDVI values to the corresponding phenological phases allowed a conclusion that the highest values of the vegetation index are reached in the phase of fruit formation regardless terms of the crop seedlings plantation (Table 1-2). The mentioned phase is a critical phase for the crop in terms of water and nutrition supply, therefore, it is possible to manage crop irrigation and fertilization using remote sensing data so that not to miss the period of the critical crop demand for the vital elements (Ushkarenko, 1994).
Table 1. NDVI values corresponding phenological phases of May-planted tomato (averaged for 2016-2021).
| Phenological phase | Mean NDVI ± SD |
|---|---|
| Planting the seedlings | 0.17±0.03 |
| Green biomass growth | 0.32±0.18 |
| Budding | 0.48±0.15 |
| Flowering | 0.60±0.15 |
| Fruit formation | 0.69±0.07 |
| Fruit ripening to maturity | 0.45±0.23 |
Table 2. NDVI values corresponding phenological phases of June-planted tomato (averaged for 2016-2021).
| Phenological phase | Mean NDVI ± SD |
|---|---|
| Planting the seedlings | 0.16±0.03 |
| Green biomass growth | 0.41±0.22 |
| Budding | 0.52±0.15 |
| Flowering | 0.68±0.14 |
| Fruit formation | 0.69±0.07 |
| Fruit ripening to maturity | 0.21±0.19 |
Another study also confirmed the possibility of accurate phenological monitoring with NDVI values (Patel & Oza, 2014). However, different soil or planting conditions, as well as genotypes and ripening groups, may lead to wrong definition of growth stages. Furthermore, differences may occur due to different raw data sources, such as Sentinel or Landsat images used to calculate NDVI values. (Terekhin, 2014). Although the general dynamic pattern of annual NDVI trend is clear, multiple studies are required to provide substantial information for the practical application of the vegetation index patterns in crop identification models and phenological monitoring (Mao et al., 2003).
Genuine NDVI dynamics, discovered based on long-term large-scale studies, are applied in automatic crop recognition systems with a relatively high precision (mean error below 8%), because different crops have their individual spatial index pattern, as stated by numerous studies (Hanbing et al., 2011; Khvostikov & Bartalev, 2018). However, our previous study showed that, despite the clear difference between crops belonging to different families and species, e.g., grain corn and sunflower, some kindred crops, e.g., winter wheat and winter barley, possess very close annual NDVI dynamics that makes it difficult to distinguish between these crops (Lykhovyd, 2021). In addition to all these mentioned facts, mathematical algorithms for crop recognition and mapping are very important for improving the automatic crop identification (Kumar et al., 2015).
Conclusions
The results of this study enabled us to determine the NDVI dynamics of tomato plants grown in southern Ukraine. It was discovered that the highest NDVI values are reached in July and August for May and June planted tomato, respectively. The spatial vegetation index reached its height (0.69±0.07) in the phase of fruit formation, then a gradual decrease was recorded. The pattern of annual NDVI change in tomato crop could be implemented in the automatic crop identification, mapping, and phenological monitoring models.
Acknowledgements
The authors thank the directorate and workers of the agricultural holding 'Agrofusion' for the possibility of study conduction and valuable support.
References
Dychenko O.Y. & Laslo O.O. (2020). Modeling spatial variation of vegetation cover diversity with the help of remote land sounding. Bull Poltava State Agrar Acad 4: 13-20. Google Scholar Cross Ref
Hanbing Z., Xiaoping Y., Jialin L. (2011). MODIS data based NDVI Seasonal dynamics in agro-ecosystems of south bank Hangzhouwan bay. Afr J Agric Res 6: 4025-4033. Google Scholar Cross Ref
Khvostikov S.A., Bartalev S.A. (2018). Development of seasonal NDVI profiles references for main agricultural crops. InfTechnol Remote Sens.Earth RORSE 55-59. Google Scholar Cross Ref
Kumar P., Gupta D.K., Mishra V.N., Prasad R. (2015). Comparison of support vector machine, artificial neural network, and spectral angle mapper algorithms for crop classification using LISS IV data. Int J Remote Sens 36: 1604-1617. Google Scholar Cross Ref
Li C., Li H., Li J., Lei Y., Li C., Manevski K., Shen Y. (2019). Using NDVI percentiles to monitor real-time crop growth. Comput Electron Agric 162: 357-363. Google Scholar Cross Ref
Lykhovyd P.V. (2021). Seasonal dynamics of normalized difference vegetation index in some winter and spring crops in the South of Ukraine. Agrology 4: 187-193. Google Scholar Cross Ref
Lykhovyd Р., Lavrenko S., Lavrenko N. 2020. Forecasting grain yields of winter crops in Kherson oblast using satellite-based vegetation indices. Bioscience Res 17: 1912-1920. Google Scholar Cross Ref
Magney T.S., Eitel J.U., Huggins D.R., Vierling L.A. (2016). Proximal NDVI derived phenology improves in-season predictions of wheat quantity and quality. Agric For Meteorol 217: 46-60. Google Scholar Cross Ref
Mao X., Zhang Y., Shen Y.J. (2003). Analysis dynamics and influence elements of winter wheat normalized difference vegetation index in mountain-foot plain. Chin J EcoAgric 11: 36-37. Google Scholar Cross Ref
O’Connell M., Whitfield D., Abuzar M., Sheffield K., McClymont L., McAllister A. (2010). Satellite remote sensing of crop water use in perennial horticultural crops. Program Abstr Aust Irrig Conf Held Syd 129-130. Google Scholar Cross Ref
Pan Z., Huang J., Zhou Q., Wang L., Cheng Y., Zhang H., Blackburn G.A., Yan J., Liu J. (2015). Mapping crop phenology using NDVI time-series derived from HJ-1 A/B data . Int J Appl Earth Obs Geoinf 34: 188-197. Google Scholar Cross Ref
Patel J.H., Oza M.P. (2014). Deriving crop calendar using NDVI time-series. Int Arch Photogramm Remote Sens Spat InfSci 40: 869. Google Scholar Cross Ref
Rouse J.W., Haas R.H., Schell J.A., Deering D.W. (1974). Monitoring vegetation systems in the Great Plains with ERTS. NASA Spec Publ 351: 309-330. Google Scholar Cross Ref
Savin I.Y., Negre, T. (2003). Relative time NDVI mosaics as an indicator of crop growth. Remote Sens AgricEcosyst HydrolIV 4879: 100-107. Google Scholar Cross Ref
Seo B., Lee J., Lee K.D., Hong S., Kang S. (2019). Improving remotely-sensed crop monitoring by NDVI-based crop phenology estimators for corn and soybeans in Iowa and Illinois, USA . Field Crops Res 238: 113-128. Google Scholar Cross Ref
Shammi S.A., Meng Q. (2021). Use time series NDVI and EVI to develop dynamic crop growth metrics for yield modeling . Ecol Indic 121: 107124. Google Scholar Cross Ref
Terekhin E.A. (2014). Analysis of the seasonal dynamics of NDVI index and the reflective properties of corn in the Belgorod Region. Mod Probl Remote Sens Earth 11: 244-253. Google Scholar Cross Ref
Tian F., Brandt M., Liu Y.Y., Verger A., Tagesson T., Diouf A.A., Rasmussen K., Mbow C., Wang Y., Fensholt R. (2016). Remote sensing of vegetation dynamics in drylands: Evaluating vegetation optical depth (VOD) using AVHRR NDVI and in situ green biomass data over West African Sahel . Remote Sens Environ 177: 265-276. Google Scholar Cross Ref
Trout T.J., Johnson L.F. (2007). Estimating crop water use from remotely sensed NDVI, crop models, and reference ET. USCID Fourth Int Conf.Irrig Drain Sacram Calif 275-285. Google Scholar Cross Ref
Ushkarenko V.O., Vozhehova R.A., Holoborodko S.P., Kokovikhin S.V. (2020). Field experiment methodology (irrigated agriculture). OldiPlus, Kherson. Google Scholar Cross Ref
Ushkarenko V.O. (1994). Irrigated Agriculture. Urozhaj, Kyiv. Google Scholar Cross Ref
Vozhehova R., Maliarchuk M., Biliaieva I., Lykhovyd P., Maliarchuk A., Tomnytskyi A. (2020). Spring row crops productivity prediction using normalized difference vegetation index. J Ecol Eng 21: 176-182. Google Scholar Cross Ref
Wan X., Wang W., Liu J., Tong T. (2014). Estimating the sample mean and standard deviation from the sample size, median, range and/or interquartile range. BMC medical research methodology, 14: 1-13. Google Scholar Cross Ref
Zhukov O., Gofman O. (2016). Analysis of time series NDVI for vegetation of Velykyi Chapelskyi pid for 2010–2015. Sci Works NaUKMA, 184: 40-46. Google Scholar Cross Ref